Student's t-test: How Guinness Brewed a Statistical Revolution
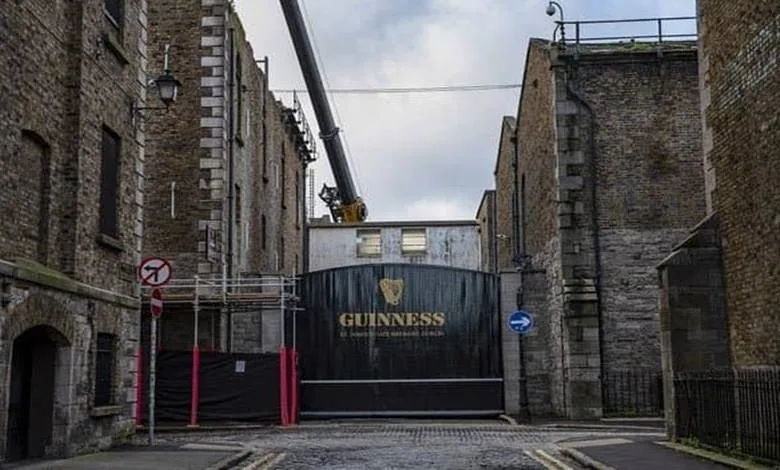
The Student's t-test origin traces to 1908, when William Sealy Gosset, a chemist at the Guinness brewery in Dublin, published a new statistical method under the pen name "Student." He needed a reliable way to judge small samples of barley and beer, and the tool he built became one of the most widely used tests in all of science. What makes the story remarkable is the setting: a working brewery, not a university. Gosset was solving a practical problem on the factory floor, and his solution quietly reshaped how researchers everywhere draw conclusions from limited data.
In 1908, William Sealy Gosset, a chemist at the Guinness brewery in Dublin, published the statistical method now known as the Student's t-test under the pseudonym "Student." He devised it to draw reliable conclusions from small samples, and the name stuck because Guinness required employees to publish anonymously.
- William Sealy Gosset was a chemist working for the Guinness brewery in Dublin when he developed the method in the early 1900s.
- Gosset published his small-sample method in 1908 under the pen name "Student," which is why it is called the Student's t-test.
- Guinness barred its employees from publishing under their own names, so Gosset adopted a pseudonym to share his work.
- The test allowed brewers and scientists to assess the quality of barley and beer using small numbers of samples rather than large ones.
- The method later gained wider acceptance after other statisticians, including Ronald Fisher, examined and extended the underlying mathematics.
A Brewery That Accidentally Invented Modern Statistics
Arthur Guinness founded the Guinness brewery in Dublin in 1756. Nearly a century and a half later, that same brewery became the unlikely birthplace of one of the most important hypothesis tests in all of science. The Student's t-test origin story begins not in a university lecture hall, but on a factory floor surrounded by hops, barley, and the smell of fermenting stout.
Here is the twist that surprises almost everyone. When scientists declare a result "statistically significant," the method they often lean on is the t-test. And the t-test was born from a very practical problem: how do you judge the quality of beer when you can only test a small sample of it?
Before we go further, one common misconception is worth clearing up. Guinness is a specific brand of Irish dry stout, not a unique black beer style. Stout and porter are brewed all over the world by countless breweries. The reason Guinness matters to this story has nothing to do with owning a style of beer. It matters because of what happened inside its walls in the late 19th century.
By the late 19th century, Guinness was scaling up production fast. The company wanted a scientific approach running through the whole process, from growing barley all the way to the taste of the finished pint. Before that shift, the brewers judged quality by eye and by nose. They looked at the appearance and smell of the hops and made a call.
Once scientifically trained brewers were hired, the approach became more objective. Thomas Bennett Case, a scientifically trained brewer at Guinness, reportedly took up his post in 1893, though the exact year and his status as the first cannot be confirmed. Case believed the soft resin content in hops was tied to Guinness's quality. He wanted to estimate that soft resin ratio across a given crop.
His problem was a familiar one. No scientist can measure everything at once. He could not possibly test the soft resin in every single hop flower under his care. So he sampled instead. According to the original account, Case reportedly took 11 samples of 50 grams each from the hops and measured the soft resin in each one, though these exact figures cannot be verified. Then he averaged those values, hoping a small sample would represent the whole crop.
For comparison, a colleague reportedly took 14 new samples of 50 grams each from the same batch, though that number cannot be reliably confirmed. The measurements were repeated. But the two averages did not line up exactly. A small gap sat between them, and that gap would drive Case up a wall.
Solving it would take a new arrival. William Sealy Gosset, freshly graduated from Oxford University, started working at the Guinness brewery in Dublin in 1899.
Hops, Resin, and the Problem of the Small Sample
Picture a brewery floor in Dublin in the 1890s, and picture a man who cannot possibly do the job the way a modern lab would. He has thousands of hop cones in front of him, and he needs one number: how much soft resin is in this whole crop. He cannot measure every cone. Nobody can. So he measures a handful and hopes the handful speaks for the rest.
That is the entire problem in miniature, and it is the seed from which the Student's t-test origin story grows.
Before anyone brought science through the door, Guinness brewers judged quality with their eyes and their noses. They looked at the hops, they smelled them, and they made the call. It worked well enough for a while, but it is not a measurement. It is a guess dressed up as a decision.
Hops, for anyone who has never held one, are the cone-like flowers of Humulus lupulus, a plant in the same family as the mulberry. Once mature, the flowers are picked and dried, and they are what gives beer its gentle bitterness and its unmistakable color. Get the hops wrong and you get the beer wrong. Everything downstream depends on them.
As Guinness grew, the company wanted a scientific grip on the whole chain, from the barley fields to the taste in the glass. Scientifically trained brewers were brought in. According to the original account, the first of them was Thomas Bennett Case, said to have taken up the post in 1893, though the exact year and his status as the very first cannot be confirmed with certainty. What the story does hold onto is his conviction: Case believed the soft resin content in hops was tied to Guinness's quality, and he wanted to estimate how much of it sat in a given crop.
So he sampled. As the story goes, Case took 11 samples of 50 grams each from the hops and measured the soft resin in every one, then averaged them. His logic was plain and human: the average of a small scoop should stand in for the whole harvest.
Then a colleague ran the same exercise. Reportedly, he pulled 14 fresh samples of 50 grams each from the same batch, and the measurements were repeated from scratch.
The two averages did not match.
Not by a lot. By a little. And that little gap was enough to stop everything. Was the difference real, a genuine signal about the hops? Or was it just the noise you get when you weigh tiny scoops instead of the whole field? Case had no way to tell the two apart, and the numbers just sat there, not matching.
A deadlock like that does not resolve itself. It waits for someone who can do the arithmetic that turns a small, noisy sample into a trustworthy answer.
The Oxford Graduate Who Arrived in 1899
William Sealy Gosset walked into the Guinness brewery in Dublin in 1899, fresh out of Oxford University, and he was exactly the person the company's hop problem had been waiting for. Gosset, born in 1876 and dead by 1937, was a British statistician and chemist by training, and he arrived just as the brewery was drowning in a question nobody could answer: how do you trust a measurement taken from a handful of hop flowers when every flower in the field might be different?
Here is the thing about statistics in 1899. It was built for big numbers. The whole field ran on what was called large sample theory, and it worked, but only if you had a mountain of data behind it, usually at least 150 observations. Guinness did not have 150 observations. Guinness had a brewer pulling a few dozen samples from a single batch of hops, and the math that existed simply shrugged at that kind of number. The tools were built for astronomers counting stars, not brewers counting flowers.
So Gosset set out to do something the orthodox statisticians of his day would have called impossible. He wanted to take Karl Pearson's large-sample methods, the gold standard of the era, and bend them until they fit the tiny samples Guinness actually used. In 1906 he began working with Pearson directly, spending time in the older man's laboratory, absorbing the mathematics that the whole discipline treated as settled. Then he carried it back to the brewery floor and started reshaping it.
The result of that reshaping would eventually carry Gosset's fingerprints into biology, physics, psychology, biometry, economics, and medicine. But in 1899, none of that existed yet. There was just a young Oxford graduate, a warehouse full of hops, and a statistical rulebook that did not cover the situation he was standing in.
The Pseudonym That Gave the Test Its Name
In 1908, a paper called The Probable Error of a Mean landed in the journal Biometrika, signed by someone named "Student." The author was William Sealy Gosset, a British chemist and statistician born in 1876, who had joined the Guinness brewery in Dublin in 1899. That single paper became the foundation of the Student's t-test, and the pseudonym stuck.
Why hide? Because Guinness was guarding more than a recipe. The company discouraged its employees from publishing under their own names, worried that rival brewers would pick up the scientific methods behind its beer, though the precise date that policy ended cannot be confirmed. So Gosset, who had spent time in Karl Pearson's biometric laboratory beginning in 1906, folded his small-sample work into a manuscript and signed it with a borrowed identity.
The name "Student" was not a joke. It was a shield, and it kept Gosset's employer happy while his mathematics slipped quietly into the scientific record.
There is a tidy irony here. The most cited test in statistics carries a pseudonym because a brewery wanted to protect its edge in hops and barley. Gosset kept working at Guinness for the rest of his life, and his identity as "Student" was known to some during his lifetime, while the timing of broader public revelation after 1937 cannot be confirmed precisely. By then the t-test was already spreading through biology, physics, psychology, biometry, economics and medicine, usually without anyone asking who Student actually was.
What the t-Distribution Actually Solves
Small hop samples quietly added a brand new source of uncertainty to every measurement, and that is exactly the problem William Sealy Gosset set out to fix. When Thomas Bennett Case, the brewery's scientifically trained brewer, pulled samples of hops and measured their soft resin content, the averages from different batches of the same crop never lined up perfectly. Two sets of readings from the same harvest produced two slightly different numbers. Were those gaps real differences between the batches, or just the noise that comes from measuring a small handful of flowers instead of the whole field?
That question is the whole reason the t-distribution exists, and it is the beating heart of the Student's t-test origin story. Gosset's insight was to work out a mathematical description of how sample size and the uncertainty it imposes are linked. The t-distribution is a mathematical map of how sample size and uncertainty are tied together. Once you can describe that relationship, you can account for sample size directly and decide how much confidence to place in your findings instead of guessing.
What the t-test actually compares
The t-test boils down to this: take two groups, compare their averages, and ask if the gap is real or just random noise. It comes in two main flavors, and the distinction matters.
| Type | What it evaluates | Typical example |
|---|---|---|
| Independent samples t-test | Whether means differ between two separate, unrelated groups | A treatment group versus a placebo control group |
| Paired samples t-test | Differences between two conditions measured on the same individuals | Comparing the same subjects before and after a treatment |
The paired version is the one the brewers had to reach for. They were not comparing two unrelated batches of strangers; they were measuring the same crop, the same flowers, the same conditions twice over. When your two sets of numbers come from the same source, you cannot treat them as independent, and the paired samples t-test is built for exactly that situation.
The point of all this machinery is not elegance for its own sake. It is to let a brewer, or a doctor, or a psychologist, look at a small pile of measurements and say something honest about how much they should trust the result. That is the gift the t-distribution quietly handed to anyone who ever needed to draw a conclusion from too few data points.
Ronald Fisher Makes It Famous
For years after 1908, Gosset's small-sample method sat in plain sight with almost nobody picking it up. Statisticians trained on large-sample theory looked at a formula built for a dozen hops readings and shrugged. The paper was elegant. The world was not ready.
Then Ronald Aylmer Fisher arrived. Fisher, a British statistician and biologist who lived from 1890 to 1962, did not treat Gosset's work as a curiosity. He championed it, and more than that, he supplied the mathematical proof the method had been missing. Where Gosset had shown that the t-distribution worked in practice, Fisher showed why it had to work, deriving the theoretical justification that turned a brewer's practical trick into a rigorous statistical tool.
That endorsement changed everything. Once Fisher had put his name and his mathematics behind it, the t-test spread far beyond the brewery floor. Researchers in biology, physics, psychology, biometry, economics, and medicine began reaching for it whenever they needed to compare two sets of measurements. The same logic Gosset had worked out to compare hop samples became the standard way to ask whether a drug outperformed a placebo, whether two teaching methods produced different results, whether an economic intervention moved the needle.
Today the t-test is a core part of undergraduate statistics education across all those disciplines. Students who have never brewed a thing learn it in their first statistics course, usually without any idea where it came from. Few of them know the role William Sealy Gosset played in its creation. Fewer still know the beer-based reasons behind it: a chemist at a Dublin brewery, forbidden from publishing under his own name, quietly solving a problem that would outlive him by decades.
Gosset's Life at Guinness and the Secret Revealed
William Sealy Gosset never left the brewery that made him famous. He stayed at Guinness in Dublin for the rest of his working life, and by the end of his career he had climbed to the top of its scientific ranks. The man the world would come to know only as "Student" died in 1937, his double life intact to the end.
He rose through the company steadily. Gosset rose to head experimental brewer at Guinness, though whether he headed a statistics department he established cannot be reliably confirmed. What is certain is where he ended up: in 1935, Gosset was appointed chief brewer of the new Guinness brewery in London, a clear sign of how much the company trusted the quiet chemist from Oxford.
Through all those years he kept publishing. Papers came out under the name "Student," one after another, because Guinness did not want its rivals learning the scientific methods behind its beer. The pseudonym worked so well that his real identity stayed hidden from the wider public. His identity as "Student" was known to some during his lifetime, and the timing of broader public revelation after 1937 cannot be confirmed precisely.
That is the strange legacy of the Student's t-test origin. A statistician who spent his whole career checking hops and barley ended up giving science one of its most powerful tools, and he did it without ever signing his own name to it.

Frequently asked questions
Who invented the Student's t-test?
William Sealy Gosset, a British statistician and chemist born in 1876, invented the method behind the Student's t-test. He graduated from Oxford University in 1899 and joined the Guinness brewery in Dublin that same year, where he worked on statistical problems tied to brewing quality until his death in 1937.
Why is it called the Student's t-test?
Gosset published his landmark 1908 paper, "The Probable Error of a Mean," in the journal Biometrika under the pseudonym "Student." Guinness discouraged employees from publishing under their own names, worried that rival brewers would learn the company's scientific methods, so the invented name stuck to the test itself.
How did Guinness brewery lead to the invention of the t-test?
Guinness brewers needed to judge the quality of hops and beer from small samples, but the statistics of the day relied on large-sample theory that generally demanded at least 150 observations. Gosset adapted those methods for the small samples the brewery actually used, and that work became the foundation of the t-test.
What problem was Thomas Bennett Case trying to solve?
Thomas Bennett Case, a scientifically trained brewer at Guinness, believed the soft resin content in hops was linked to the quality of the finished beer. He needed to estimate that resin level from small samples rather than measuring every hop flower in a crop, which is what pushed the brewery toward sampling and statistics.
How did Ronald Fisher help popularize the Student's t-test?
Gosset's method did not make an immediate splash in the statistical world. It became visible once Ronald Aylmer Fisher, the British statistician and biologist who lived from 1890 to 1962, championed it and supplied a mathematical proof, after which the t-test spread across biology, physics, psychology, biometry, economics, and medicine.
What is the difference between independent and paired samples t-tests?
An independent samples t-test compares the means of two separate groups, such as a treatment group against a placebo control group. A paired samples t-test compares two conditions measured on the same individuals, like a before-and-after reading, and this was the type the Guinness brewers had to rely on.
When did Gosset's real identity become known to the public?
Gosset's identity as "Student" was known to some during his lifetime, and the timing of broader public revelation after his death in 1937 cannot be confirmed precisely. He kept publishing under the pseudonym while rising at Guinness and was appointed chief brewer of the new London brewery in 1935.
Why does the t-distribution matter for small sample sizes?
The t-distribution is a mathematical map of how sample size and uncertainty are tied together. It lets brewers and scientists account for how many observations they actually have, so they can judge how much confidence to place in findings drawn from a handful of measurements rather than a huge dataset. Editorial note: Details that remain unconfirmed are presented as such, and no figures have been invented.
Got a take on this? Add your voice to the conversation below →
No comments yet. Be the first.