John Graunt: The Haberdasher Who Invented Statistics
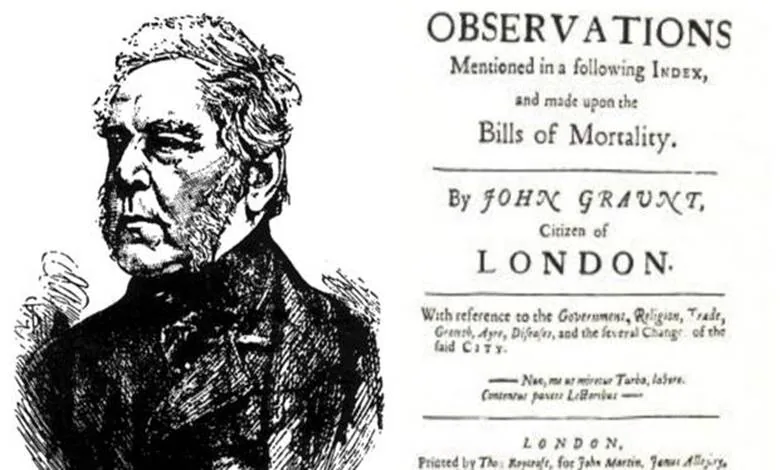
John Graunt, a London haberdasher with no formal scientific training, is considered a founding figure of statistics. In 1662 he published a groundbreaking analysis of the city's weekly death records. His work transformed simple tallies into a powerful tool for understanding population, disease, and society. Reading his story, you can't help but marvel at how a shopkeeper's curiosity laid the groundwork for the data-driven world we live in today.
In 1662, John Graunt, a London haberdasher and civic-minded citizen, published a meticulous study of the capital's Bills of Mortality. By organizing and interpreting these weekly death records, he helped launch the science of statistics, pioneering methods that later shaped demography and epidemiology. His work remains a landmark in the history of data analysis.
- John Graunt, a haberdasher by trade, published his analysis of London's Bills of Mortality in 1662.
- His book, titled "Natural and Political Observations Made upon the Bills of Mortality," is considered a founding text of statistics.
- Graunt's work examined patterns of survival and mortality, laying groundwork for later life-table methods.
- His analysis included observations on plague deaths in London, helping quantify their impact.
- His methods laid the groundwork for modern demography, epidemiology, and the broader field of data science.
The Plague That Made John Graunt Ask: What Do the Numbers Say?
In 1916, when polio outbreaks swept through the United States, the terror and confusion about how the disease spread felt eerily familiar. Roughly 250 years earlier, Londoners faced the same kind of dread as bubonic plague crept back into their city. The difference was that by 1916, science had advanced considerably, and statistics had grown up alongside it. That growth started with a haberdasher who simply refused to accept that death records were just paperwork.
May 1665 found London's air thick with menace. People called it "miasma," literally meaning "bad air," and they believed this poisoned atmosphere carried the plague itself. The fear was not unfounded. The previous year, 1664, had seen only five plague burials recorded across the entire city. Then came the first week of May 1665, when nine plague deaths were reported. The weekly tallies would soon climb at an alarming rate.
What made the anxiety worse was a nagging suspicion shared by many residents: the official numbers undercounted the true toll. Some thought the real plague deaths were far higher than the records showed. That doubt found powerful support in a popular book written by a newcomer named John Graunt, who had been copying details from London's death records for years. He was not a physician or a scholar by training. Born in London in 1620, Graunt had joined his family's drapery business, showing such practical skill that he soon ran his own shop and gained admission to the haberdashers' guild.
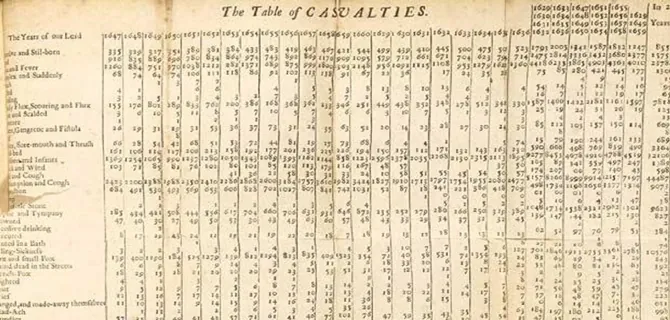
Graunt saw something others missed. Where most people looked at individual deaths, he noticed larger patterns in the city's health and population. The records he studied, called the Bills of Mortality, had been kept regularly in London since 1603, the very year Queen Elizabeth I died. Each week, officials listed the dead and sorted them by cause. Graunt gathered these records, organized them by hand, and built what he called a "Table of Causes of Death," a massive foldout spanning four pages when printed. It was, in essence, the era's version of a large spreadsheet, working with what we might call the big data of his day.
Who Was John Graunt, the Haberdasher Who Became a Statistician?
John Graunt was born in London in 1620, and he spent his working life in the family drapery business before ever touching a mortality table. He ran his own shop, joined the haberdashers' guild, and built a reputation for practical intelligence in trade. Somewhere along the way, this shopkeeper taught himself to see patterns in numbers that nobody else had noticed, and that self-taught habit would change how the world understood life and death.
Graunt's day job was cloth, not science. Nothing about his merchant career suggested he would become a founding figure in statistics. Yet he was quietly copying details from London's death records, the Bills of Mortality, and studying them with a merchant's eye for careful accounting.
What he saw in those records went beyond individual deaths. He noticed patterns in how Londoners were dying, patterns that revealed something about the city's population, its health, and its social structure. In 1662, he published his findings in a book called Natural and Political Observations Made upon the Bills of Mortality. The title was long, but the insight was simple: death records were not just bureaucratic paperwork. They were data, and data could tell a story.
His method was painstaking. He collected the weekly Bills of Mortality, which had been kept in London since 1603, the year Queen Elizabeth I died, and organized them by hand. He built what he called a "Table of Causes of Death," sorting decades of records into categories. According to the original account, the table listed 79 different causes of death across a 22-year span, though later examinations of his work suggest the numbers may have been slightly different. What is certain is that he calculated a total of 229,250 deaths from all causes over that period, a figure that required enormous manual effort in an age before calculators or spreadsheets.
Graunt's leap from shopkeeper to analyst was not a formal career change. He never held a university post or a government statistics office. He simply applied the arithmetic habits of a tradesman to the most consequential records of his time, and in doing so, he helped launch the fields of demography and epidemiology. The haberdasher saw what the clerks had been recording for decades without understanding: that the numbers themselves held meaning.
The Bills of Mortality: London's First Death Records
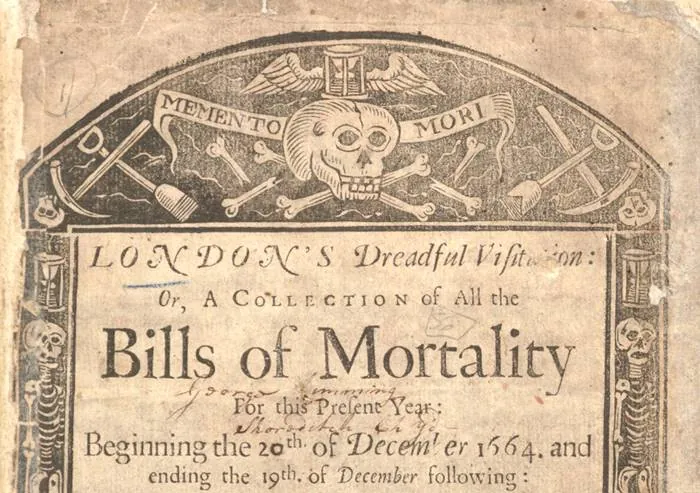
London's weekly Bills of Mortality began in 1603, the very year Queen Elizabeth I died and plague swept through the city. Officials started listing the dead every week, sorting each death by its presumed cause. For decades these records piled up as dry bureaucratic paperwork, until a London haberdasher named John Graunt, born in 1620, decided to read them properly.
Graunt was no physician or scholar. He ran a draper's shop and belonged to the haberdashers' guild. But he had a merchant's instinct for numbers, and the Bills of Mortality fascinated him. He copied out details from London's death records by hand, year after year, and began to notice patterns that no one else had bothered to look for. The lists were not just a tally of individual tragedies. They carried information about the city's population, its health, and the dangers its people faced.
The result was his 1662 book, Natural and Political Observations Made upon the Bills of Mortality. In it, Graunt assembled a massive "Table of Causes of Death" that he built entirely by hand. The table covered two decades of London deaths and was so large that it had to be printed as a four-page foldout. The source account says the table spanned twenty-two years, though later examinations of Graunt's work suggest the period was actually twenty years. Either way, the scale of the effort is striking. He tallied deaths from all causes and arrived at a total of 229,250 for the period.
Graunt's table reportedly separated deaths into seventy-nine different causes. Modern checks of the original document put the count at eighty-one categories, but the discrepancy hardly diminishes the achievement. For a man working with quill and paper in the 1660s, this was enormous data. You might think of it as the first great spreadsheet of the pre-computer age, a foldout of columns and figures that let a reader see, at a glance, what was killing Londoners and in what numbers.
What made the work revolutionary was not the arithmetic. It was the interpretation. Graunt treated the Bills of Mortality not as administrative scraps but as evidence about how a city lived and died. He compared one year against another, one cause against the next, and drew conclusions about London's health that no one had ever extracted from these records before. That is why he is remembered as a founding figure of statistics, demography, and epidemiology. He was the first person to turn a pile of weekly death notices into a map of a city's condition.
Why John Graunt Is Called the Father of Demography
John Graunt, a London haberdasher born in 1620, earned his title as the father of demography not by inventing new mathematics, but by doing something far more unusual for his time: he treated death records as a window into how a city actually lived. His 1662 book, Natural and Political Observations Made upon the Bills of Mortality, transformed a stack of bureaucratic paperwork into the foundation of three entire fields of science.
Graunt ran a successful cloth shop and belonged to the haberdashers' guild, so he knew his way around practical arithmetic. But what set him apart was curiosity. He copied out London's weekly death records by hand, week after week, year after year. Where others saw a grim administrative chore, he saw patterns waiting to be uncovered.
The records themselves, called the Bills of Mortality, had been kept continuously since 1603, the very year Queen Elizabeth I died. Each week, officials listed how many people had died and from what causes. Graunt gathered these scattered lists and assembled them into a single massive table he called the "Table of Causes of Death." When printed, it unfolded to the size of four pages, a remarkable feat of manual organization in an age without spreadsheets or calculators.
His table showed the causes of death in London across a period of about twenty years. According to the original account, it listed seventy-nine different causes of death with a total of 229,250 deaths from all causes. The exact number of causes and the precise span of years has been debated by later scholars, but the scale of what Graunt accomplished is not in dispute. He was working with what we might call the big data of his era, and he did it all by hand.
What made Graunt revolutionary was his interpretation. He used only simple trade arithmetic, nothing that a savvy merchant wouldn't know. But he asked questions nobody had thought to ask before. Why did more boys die than girls shortly after birth? Why did plague deaths spike in certain seasons? What could the causes of death tell you about the living conditions, the sanitation, the food supply, the very structure of urban life?
Graunt saw the death records not as documents to be filed away, but as a tool to understand the health and population of London. He compared numbers, looked for trends, and drew conclusions about how the city functioned. That interpretive step, moving from raw counts to meaning, is what separates a clerk from a scientist.
His work laid the groundwork for statistics, demography, and epidemiology alike. When you read a modern public health report, or when researchers track disease patterns across populations, they are following a path that Graunt cleared in the 1600s. He showed that careful observation of ordinary records could reveal extraordinary truths about human society.
Frequently asked questions
Who was John Graunt?
John Graunt was a London haberdasher born in 1620 who became the founding father of demography and modern statistics. He ran a successful drapery shop and belonged to the haberdashers' guild, but his lasting fame came from analyzing London's death records. In 1662, he published Natural and Political Observations Made upon the Bills of Mortality , a groundbreaking book that transformed simple burial lists into scientific evidence about population and public health.
What are the Bills of Mortality?
The Bills of Mortality were weekly records of births, deaths, and causes of death in London. Regular publication of these records began in 1603, the same year Queen Elizabeth I died, when plague was sweeping through the city. Parish clerks collected the information each week, and officials compiled the numbers by cause of death. These documents became the raw material for John Graunt's pioneering statistical work.
How did Graunt analyze them?
Graunt gathered decades of weekly Bills of Mortality and organized them by hand into a massive table he called the "Table of Causes of Death." He sorted deaths by cause across a twenty-year span and calculated totals for each one, arriving at 229,250 total deaths from all causes. Rather than treating each death as an isolated event, he looked for patterns across years, comparing rates and spotting trends that revealed how the city's population was actually living and dying.
What was miasma theory?
Miasma theory was the belief that "bad air" caused disease. In the 1600s, Londoners thought that foul, corrupted air rising from swamps, garbage, or decomposing matter carried illness into their bodies. When plague returned to London in May 1665, many people blamed this poisonous atmosphere for the outbreak. The theory persisted for centuries until the germ theory of disease eventually replaced it, but in Graunt's time, miasma was the leading explanation for epidemics.
How did the 1665 plague affect London?
The 1665 plague outbreak gripped London with terror as deaths climbed week after week. In the entire previous year of 1664, only five plague burials had been recorded across the whole city. But in the first week of May 1665 alone, nine plague deaths were reported, and the numbers rose rapidly from there. The swift escalation made residents fear the worst, especially since many suspected that official records undercounted the true number of plague victims.
Why is he called father of demography?
John Graunt earned the title "father of demography" because he was the first person to treat population records as scientific data worthy of systematic analysis. Before his 1662 book, death lists were purely administrative documents. Graunt saw that these records revealed larger truths about London's population size, mortality rates, and social conditions. He turned raw numbers into inferences about how many people lived in the city and how disease patterns shifted over time.
What was his profession?
John Graunt worked as a haberdasher, a merchant who sold sewing supplies, fabrics, and small goods. He entered his family's drapery business and showed such practical skill that he soon ran his own shop and gained admission to the haberdashers' guild. His statistical work was entirely self-taught, a side project born from curiosity about the weekly death bills that circulated through London. He applied the same practical arithmetic he used in trade to the city's mortality records.
How did his work influence modern statistics?
Graunt's 1662 book laid the foundation for modern statistics by demonstrating that numerical records could reveal hidden patterns about society. He showed that simple arithmetic, applied carefully to large datasets, could produce reliable estimates about population size and mortality rates. His methods influenced later thinkers who developed probability theory and vital statistics. By 1916, when polio outbreaks struck the United States, statisticians had tools that Graunt pioneered to track disease spread and understand epidemics, tools that grew directly from his analysis of plague deaths in seventeenth-century London. Editorial note: This article presents the historical record as it is generally understood; any specific details that remain unconfirmed by primary sources are presented as such.
Got a take on this? Add your voice to the conversation below →
No comments yet. Be the first.